Leo Jacoby
About me
I'm a high school student at the Branson School in Marin County, CA. I love coding and statistics. I do my web and mobile devlopment with Node.js and React, and I do my statistical analysis with R. I post my projects on this site, so please check them out and reach out to me with questions, feedback, or to share something related that you've done. I'm always looking for cool people, projects, and opportunities!
Email: leojacoby@gmail.com
Twitter: @leotheprocess21
Modeling Voltage across a capacitor
Background
In my AP Physics 2 class, we did an independent project around RC Circuits. The premise was that we were writing a cover letter to a potential employer. Here is my letter and project…
Click image to see project!
Cover Letter
Dear potential employer,
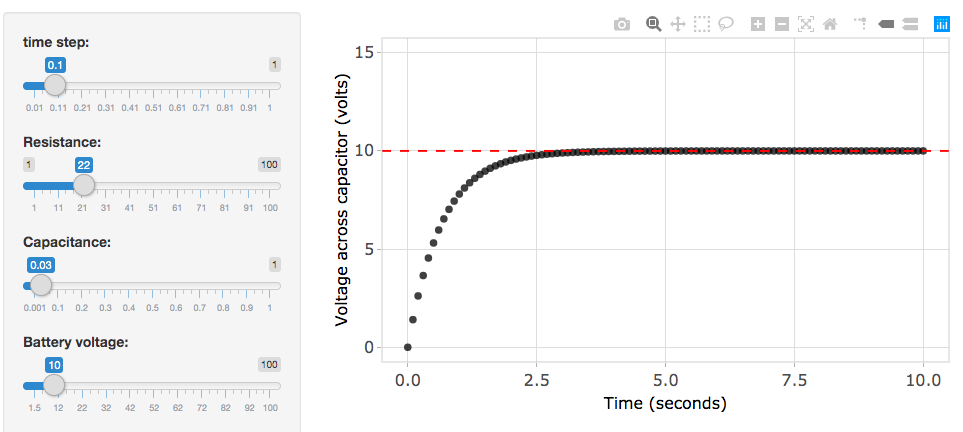
In my AP Physics 2 class, we have been studying electromagnetism and RC circuits. We began with a circuit with a capacitor, a power-resistor, and a battery, and a switch all connected in series. We connected a voltmeter to the terminals of a capacitor and used Logger Pro software to graph the voltage over time starting at the moment the switch was flipped, and observed that the charging and discharging cycles appeared to behave like an exponential function. After using Google Sheets to create a simulation of the voltage as well as other characteristics of the circuit, we used calculus to find the constants of the equation, and therefore had a complete equation that related voltage and time with variables for battery voltage, capacitance, and resistance that goes as follows…
Vcap = Vbatt[1-e^(-t/RC)]
Next, we graphed the calculus model in Google Sheets, but I was discouraged by the graph’s lack of adaptability to new voltage, resistance, and capacitance constants, and my inability to customize the design of the graph. I desired to use my skills with the R programming language and R Shiny platform to make a sleek user interface to visualize the effects of battery voltage, resistance, and capacitance on the shape and scale of the curve.
In R, I created a data table with columns for time and voltage across capacitor. I allow for the user to input their own time-step, resistance, capacitance, and battery voltage using sliders. I derived an equation that provides the moment in time that the capacitor is 99.9% charged, and I ended the data table at that moment. The equation goes as follows…
Tend = -RCln(0.001)
With this equation, I can show the user an appropriate time scale for all values of the variables. As the user changes a slider, the graph updates in real time to reflect the new curve. I then deployed my app to the web using RStudio’s platform. The URL for my project is leojacoby.shinyapps.io/rccircuit. As a data analyst, I could create interactive tools like this to allow for my coworkers to understand data. As industries can collect more and more data, it is important that we effectively harness its power as part of our decision-making processes.
Sincerely,
Leo Jacoby
Thanks for reading, and of course, if you have questions, suggestions, or want to share something similar that you’ve been working on, don’t hesitate to email me at leojacoby@gmail.com or tweet at me at @leotheprocess21.